This report covers intercepts (also known as wiretaps) concluded between January 1, 2019, and December 31, 2019, as reported to the AO, and provides supplementary information reported to the AO on arrests and convictions resulting from intercepts concluded in prior years.
Forty-eight jurisdictions (the federal government, the District of Columbia, the Virgin Islands, Puerto Rico, and 44 states) currently have laws that authorize courts to issue orders permitting wire, oral, or electronic surveillance. Table 1 shows that a total of 29 jurisdictions (including state and federal) reported using at least one of these types of surveillance as an investigative tool during 2019
Summary and Analysis of Reports by Judges
The number of federal and state wiretaps reported in 2019 increased 10 percent from 2018. A total of 3,225 wiretaps were reported as authorized in 2019, with 1,417 authorized by federal judges and 1,808 authorized by state judges. Compared to the applications approved during 2018, the number approved by federal judges decreased 3 percent in 2019, and the number approved by state judges increased 22 percent.
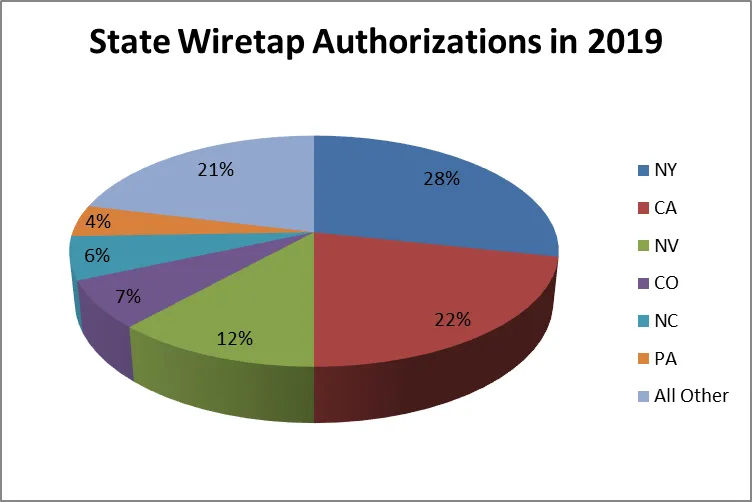
In 28 states, a total of 147 separate local jurisdictions (including counties, cities, and judicial districts) reported wiretap applications for 2019. Applications concentrated in six states (New York, California, Nevada, Colorado, North Carolina and Philadelphia) accounted for 79 percent of all state wiretap applications. Applications in California and New York alone constituted 50 percent of all applications approved by state judges.
Eighty-six federal jurisdictions submitted reports of wiretap applications for 2019. The Southern District of New York authorized the most federal wiretaps, approximately 5 percent of the applications approved by federal judges.
Federal judges and state judges reported the authorization of 938 wiretaps and 218 wiretaps, respectively, for which the AO received no corresponding data from prosecuting officials. Wiretap Tables A-1 and B-1 (which are available online at http://www.uscourts.gov/statistics-reports/analysis-reports/wiretap-reports) contain information from judge and prosecutor reports submitted for 2019. The entry “NP” (no prosecutor’s report) appears in these tables whenever a prosecutor’s report was not submitted. Some prosecutors may have delayed filing reports to avoid jeopardizing ongoing investigations. Some of the prosecutors’ reports require additional information to comply with reporting requirements or were received too late to include in this document. Information about these wiretaps should appear in future reports.
Intercept Orders, Extensions, and Locations
Table 2 presents the number of intercept orders issued in each jurisdiction that provided reports, the number of extensions granted, the average lengths of the original periods authorized and any extensions, the total number of days in operation, and the locations of the communications intercepted. Federal and state laws limit the period of surveillance under an original order to 30 days. This period, however, can be lengthened by one or more extensions if the authorizing judge determines that additional time is justified.
During 2019, the average reported length of an original authorization was 30 days, the same as in 2018. The average reported length of an extension was also 30 days. In total, 2,528 extensions were reported as requested and authorized in 2019, an increase of 87 percent from the prior year. The Northern District of Illinois (IL-N) conducted the longest federal intercept that was terminated in 2019. One original order in IL-N was extended 13 times to complete a 388-day wiretap used in a corruption investigation. An order in the District of Arizona was extended 11 times to complete a 355-day wiretap in a narcotics investigation. For state intercepts terminated in 2019, the longest intercept occurred in Queens, New York, where an original order was extended 27 times to complete a 756-day wiretap used in a corruption investigation.
The most frequently noted location in reported wiretap applications was “portable device.” This category includes cell phone communications, text messages, and application software (apps). In 2019, a total of 94 percent of all authorized wiretaps (3,047 wiretaps) were reported to have used portable devices.
Prosecutors, under certain conditions, including a showing of probable cause to believe that actions taken by a party being investigated could have the effect of thwarting interception from a specified facility, may use “roving” wiretaps to target specific persons by using electronic devices at multiple locations rather than at a specific telephone or location (see 18 U.S.C. § 2518(11)). In 2019, a total of eight reported federal and state wiretaps were designated as roving.
Criminal Offenses
Drug offenses were the most prevalent type of criminal offenses investigated using reported wiretaps. Table 3 indicates that 39 percent of all applications for intercepts (1,266 wiretap applications) in 2019 cited narcotics as the most serious offense under investigation. Applications citing narcotics combined with applications citing other offenses, which include other offenses related to drugs, accounted for 76 percent of all reported wiretap applications in 2019, an increase of 8 percent from 2018. Conspiracy, the second-most frequently cited crime, was specified in 13 percent of applications. Homicide and assault, the third-largest category, was specified as the most serious offense in approximately 4 percent of applications. Many applications for court orders revealed that multiple criminal offenses were under investigation, but Table 3 includes only the most serious criminal offense listed on an application.
Lengths and Numbers of Intercepts
In 2019, for reported intercepts, installed wiretaps were in operation for an average of 54 days, 17 days longer than the average in 2018. The federal wiretap with the most intercepts occurred during a conspiracy investigation in the Southern District of California (CA-S) and resulted in the interception of 3,113,551 messages in 149 days. The state wiretap with the most intercepts was a 484-day wiretap for a narcotics investigation in Bronx, New York, which resulted in the interception of 365,934 cell phone conversations and messages. See Table A-1 and Table B-1 for data on lengths and numbers of intercepts.
Encryption
The number of state wiretaps reported in which encryption was encountered increased from 146 in 2018 to 343 in 2019. In 334 of these wiretaps, officials were unable to decipher the plain text of the messages. A total of 121 federal wiretaps were reported as being encrypted in 2019, of which 104 could not be decrypted.
Cost of Intercepts
Table 5 provides a summary of expenses related to wiretaps in 2019. The expenditures noted reflect the cost of installing intercept devices and monitoring communications for the 1,715 authorizations for which reports included cost data. The average cost of an intercept in 2019 was $75,160, up 13 percent from the average cost in 2018. The most expensive state wiretap was in Georgia, where costs for a 178-day wiretap conducted to investigate an offense in the narcotics category resulted in 17 arrests and 1 conviction, totaled $1,920,777. For federal wiretaps for which expenses were reported in 2019, the average cost was $94,872, a 40 percent increase from 2018. The most expensive federal wiretap completed during 2019 occurred in the District of Maryland, where costs for a 120-day wiretap in a narcotics investigation that resulted in 5 arrests and no convictions totaled $2,511,137.
Methods of Surveillance
The three major categories of surveillance are wire, oral, and electronic communications. Table 6 presents the type of surveillance method used for each intercept installed. The most common method reported was wire surveillance that used a telephone (land line, cellular, cordless, or mobile). Telephone wiretaps accounted for 53 percent (1,079 cases) of the intercepts installed in 2019, the majority of them involving cellular telephones.
Arrests and Convictions
Data on individuals arrested and convicted as a result of interceptions reported as terminated are presented in Table 6. As of December 31, 2019, a total of 10,584 persons had been arrested (up 41 percent from 2018), and 2,699 persons had been convicted (up 141 percent from 2018). Federal wiretaps were responsible for 17 percent of the arrests and 9 percent of the convictions arising from wiretaps for this period. The Western District of Tennessee reported the most arrests for a federal district in 2019, with wiretaps there resulting in the arrest of 154 individuals. CA-S reported the most convictions for a federal district in 2019, with wiretaps there resulting in the conviction of 45 individuals. State wiretaps were responsible for 83 percent of the arrests and 91 percent of the convictions arising from wiretaps for this period. Queens County, New York, was the jurisdiction that reported the largest number of arrests (1,607) and the highest number of convictions (1,019) arising from a state wiretap in 2019.
Summary of Reports for Years Ending December 31, 2009, through December 31, 2019
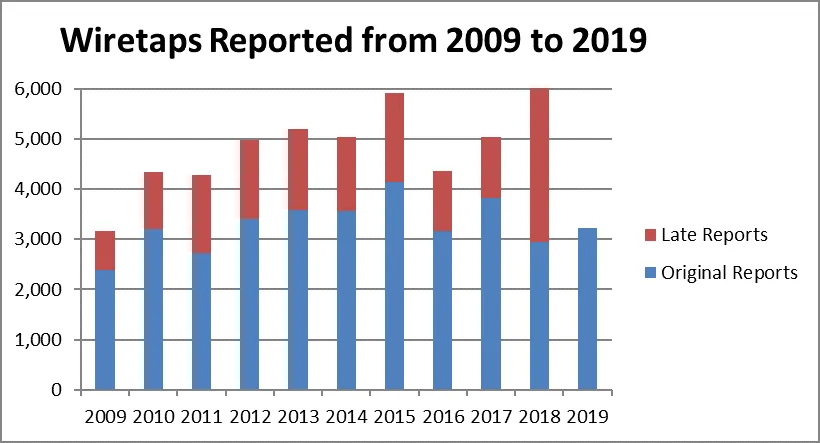
Table 7 presents data on intercepts requested and authorized each year from 2009 to 2019. Total authorized intercept applications reported by year increased 2 percent from 3,155 in 2009 to 3,225 in 2019. Most wiretaps have consistently been used for narcotics investigations, which accounted for 86 percent of intercepts authorized in 2009 (2,046 applications) and 39 percent in 2019 (1,266) applications). Table 9 presents the total number of arrests and convictions resulting from intercepts terminated in calendar years 2009 through 2019.
Supplementary Reports
Under 18 U.S.C. § 2519(2), prosecuting officials must file supplementary reports on additional court or police activity occurring as a result of intercepts reported in prior years. Because many wiretap orders are related to large-scale criminal investigations that cross county and state boundaries, supplemental reports are necessary to fulfill reporting requirements. Arrests, trials, and convictions resulting from these interceptions often do not occur within the same year in which the intercepts are first reported. Table 8 shows that a total of 7,568 arrests, 3,280 convictions, and additional costs of $45,962,870 arose from and were reported for wiretaps completed in previous years. Sixty-two percent of the supplemental reports of additional activity in 2019 involved wiretaps terminated in 2018. Interceptions concluded in 2018 led to 71 percent of arrests, 74 percent of convictions, and 58 percent of expenditures noted in the supplementary reports.