A total of 129,706 persons were under post-conviction supervision on September 30, 2018, a decrease of 4 percent from one year earlier (down 5,025 persons).
Persons serving terms of supervised release on that date following release from correctional institutions fell 3 percent to 113,189 and amounted to 87 percent of all persons under supervision.
Cases of persons under supervision in the 12-month period ending September 30, 2018, that involved probation imposed by district and magistrate judges declined 8 percent to 15,472 from the previous year and accounted for 12 percent of all persons under post-conviction supervision. The number of parole cases open at the end of 2018 dropped 6 percent to 923 (parole is not available for persons sentenced for federal offenses committed on or after November 1, 1987).
Excluding transfers, the number of persons received for supervision during 2018 fell
4 percent to 55,471. The number of persons released from correctional institutions and received for supervised release decreased 3 percent to 47,753. For persons entering the system this year, probation cases went down nearly 9 percent to 6,948, and parole cases (including cases involving special parole, military parole, and mandatory release) fell 2 percent to 316.
Forty-seven percent of persons under post-conviction supervision had been convicted of drug offenses. Eighteen percent had been convicted of property offenses. Fourteen percent had been convicted of firearms offenses. These percentages have changed little in the last five years.
The number of post-conviction supervision cases closed (including those involving transfers out of districts and deaths) held steady, decreasing less than 1 percent to 60,142. The proportion of post-conviction cases terminated successfully dropped 2 percent to 68 percent. Of those cases closed successfully, 21 percent were closed by early termination, increasing 1 percent from the previous year.
Technical violations led to 69 percent of the 17,503 revocations of post-conviction supervision reported, the same percentage as last year. New offenses accounted for the remaining revocations and for 10 percent of all 55,138 supervision cases terminated (excluding transfers out and deaths).
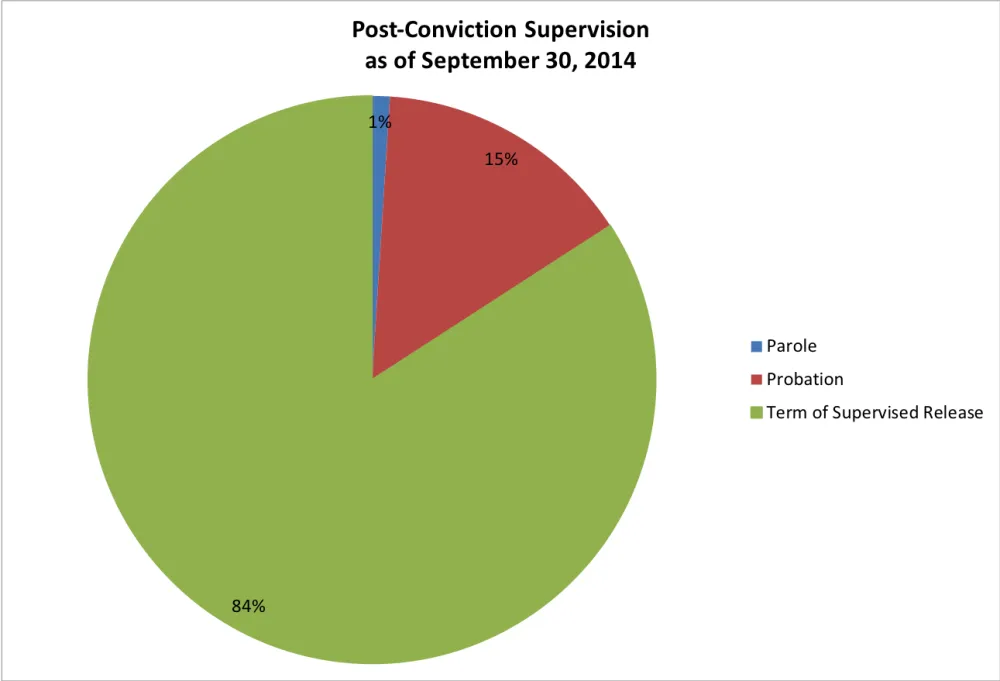
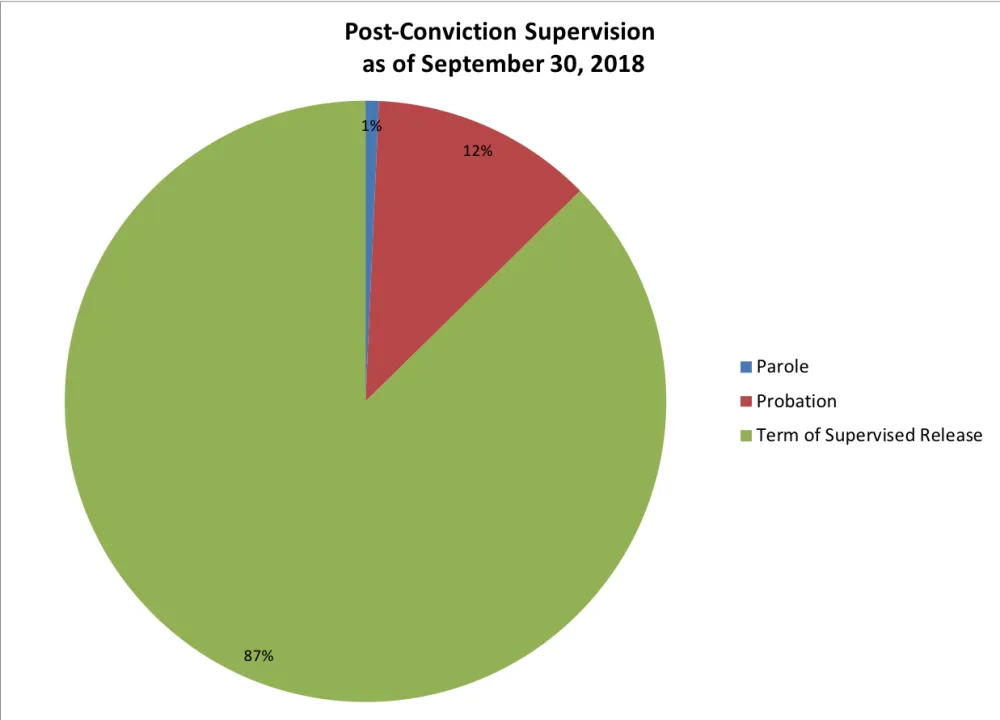
Comparing data for the last days of fiscal years 2014 and 2018 reveals that the number of persons under post-conviction supervision was 2 percent lower in 2018. Offenders under post-conviction supervision who had been convicted of drug offenses dropped from 48 percent of the total to 47 percent. Those convicted of property offenses fell from 22 percent to 18 percent of the total, and those convicted of firearms offenses increased from 12 percent to 14 percent of the total. Persons serving terms of supervised release following release from a correctional institution rose 1 percent over the past five years. In 2018, they represented 87 percent of all persons under supervision, up from 84 percent in 2014.
For data on post-conviction supervision, see Table 8 and the E series of tables.
Investigative Reports
The number of full presentence reports prepared by probation officers increased 5 percent to 67,039. Ninety-three percent of the reports (62,089) were presentence guideline reports, which are comprehensive investigative reports prepared in felony or Class A misdemeanor cases for which the U.S. Sentencing Commission has promulgated guidelines. Modified presentence reports, which are less comprehensive, represented 7 percent of total presentence investigative reports. Non-guideline reports, which are prepared for felony and Class A misdemeanor cases for which the U.S. Sentencing Commission has not promulgated guidelines, constituted less than 1 percent of investigative reports (80).
Substance Abuse Treatment
Federal offenders receive substance abuse treatment from a variety of sources—state programs, local programs, the Department of Veterans’ Affairs, and judiciary-funded substance abuse treatment services. The data presented here reflect only judiciary-funded substance abuse treatment and exclude costs associated with substance abuse testing.
Of the 73,685 offenders under supervision with court-ordered substance abuse treatment conditions, 26,421 received judiciary-funded treatment (down 281 offenders from 2017). The federal Judiciary spent an average of $1,534 per offender (up $22) for a total of $33.4 million (up $200 thousand). Nationwide, 36 percent of offenders with conditions requiring substance abuse treatment received judiciary-funded treatment, up from 35 percent in 2017.
For additional information on judiciary-funded substance abuse treatment services in the federal probation system, see Table S-13.
Judicial Business 2018
- Judicial Business 2018
- Judicial Caseload Indicators
- Judicial Business 2018 Tables
- U.S. Courts of Appeals
- U.S. District Courts
- U.S. Magistrate Judges
- Judicial Panel on Multidistrict Litigation
- U.S. Bankruptcy Courts
- Criminal Justice Act
- Post-Conviction Supervision
- Pretrial Services
- Complaints Against Judges
- Status of Article III Judgeships
- Status of Bankruptcy Judgeships
- Status of Magistrate Judge Positions and Appointments
- U.S. Court of International Trade
- U.S. Court of Federal Claims