A total of 135,468 persons were under post-conviction supervision on September 30, 2015, an increase of 2 percent from one year earlier (up 2,610 persons).
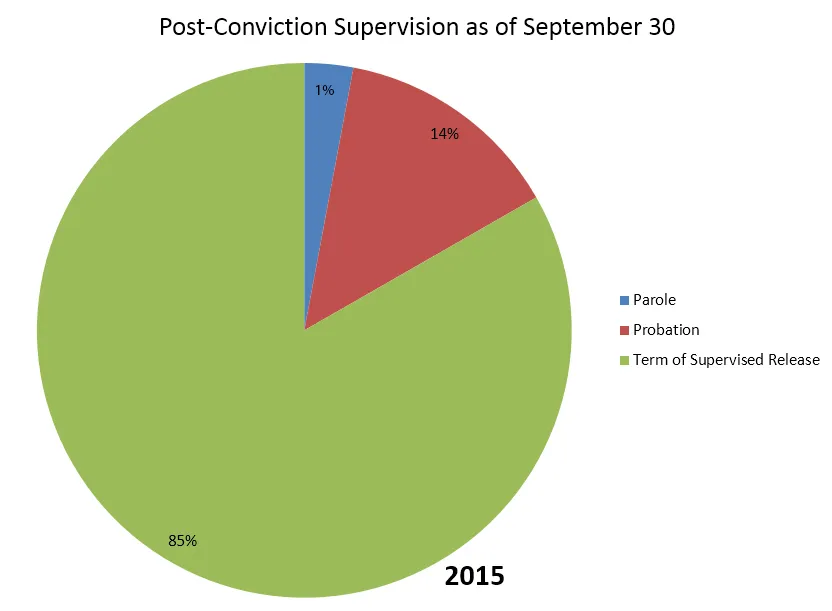
Persons serving terms of supervised release on that date following release from a correctional institution rose 3 percent to 114,961 and amounted to 85 percent of all persons under supervision.
Cases of persons under supervision in the 12-month period ending September 30, 2015, that involved probation imposed by district and magistrate judges fell 3 percent to 19,016 from the previous year and accounted for 14 percent of all persons under post-conviction supervision. The number of parole cases open at the end of 2015 dropped 10 percent to 1,203 (parole is not available for persons sentenced for federal offenses committed on or after November 1, 1987).
Excluding transfers, the number of persons received for supervision during 2015 rose
3 percent to 60,770. The number of persons released from correctional institutions and received for supervised release increased 4 percent to 50,770. For persons entering the system this year, probation cases decreased nearly 6 percent to 8,774, and parole cases (including cases involving special parole, military parole, and mandatory release) fell 5 percent to 365.
Forty-eight percent of persons under post-conviction supervision had been convicted of drug offenses. Twenty-one percent had been convicted of property offenses. Twelve percent had been convicted of firearms offenses. These percentages have changed little since 2012.
The number of post-conviction supervision cases closed (including those involving transfers out of districts and deaths) dropped 1 percent to 58,444. The proportion of post-conviction cases terminated successfully stayed unchanged at 73 percent. Of those cases closed successfully, 20 percent were closed by early termination, the same as the previous year.
Technical violations led to 69 percent of the 14,637 revocations of post-conviction supervision reported, up from 62 percent in 2014. New offenses accounted for the remaining
revocations and for 8 percent of all 53,586 supervision cases terminated (excluding transfers out and deaths).
Risk Prediction Index
The Risk Prediction Index (RPI) is an eight-question prediction instrument used by federal probation officers to estimate the likelihood that an offender will be arrested or have supervision revoked during her or his term of supervision. RPI scores range from 0 to 9, with a low score representing a lower risk of reoffending and a high score a higher risk of reoffending.
The average RPI score in 2015 was 3.69, slightly lower than the previous year. This continued a trend of relative stability for the past five years. Although recent RPI scores have been stable, they are associated with a federal post-conviction supervision population that presents challenges to probation officers and to the courts as a result of offenders’ criminogenic risks.
| Fiscal Year | Average RPI Score |
| 2011 | 3.70 |
| 2012 | 3.70 |
| 2013 | 3.72 |
| 2014 | 3.72 |
| 2015 | 3.69 |
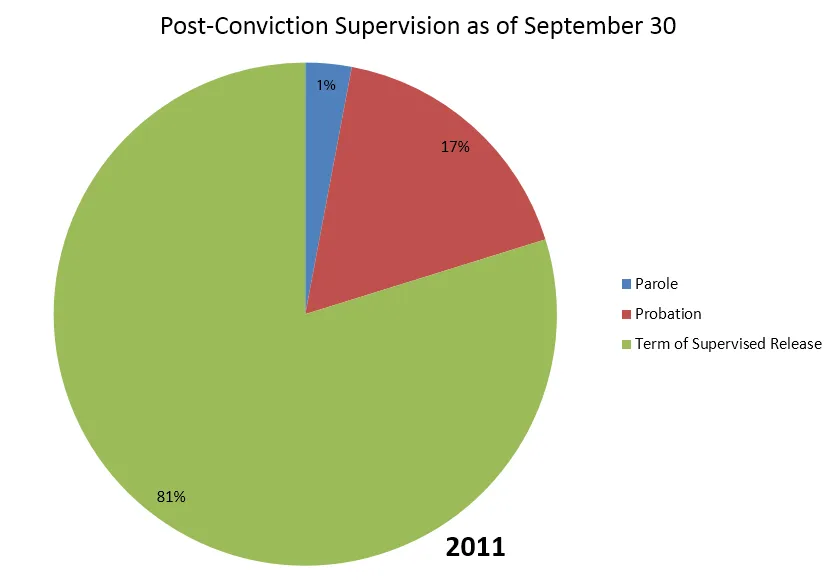
Comparing data for the last days of fiscal years 2011 and 2015 reveals that the number of persons under post-conviction supervision was 4 percent higher in 2015. Offenders convicted of drug offenses remained the same at 48 percent of persons under post-conviction supervision. Those convicted of property offenses fell from 22 percent to 21 percent of the total, and those convicted of firearms offenses held steady at 12 percent of the total. Persons serving terms of supervised release following release from a correctional institution have climbed 9 percent over the past five years. In 2015, they represented 85 percent of all persons under supervision, up from 81 percent in 2011. These increases likely stemmed from earlier growth in criminal defendant filings.
For data on post-conviction supervision, see Table 8 and the E series of tables.
Investigative Reports
The number of full presentence reports prepared by probation officers decreased 7 percent to 65,441. Ninety-three percent of the reports (60,746) were presentence guideline reports, which are comprehensive investigative reports prepared in felony or Class A misdemeanor cases for which the U.S. Sentencing Commission has promulgated guidelines. Modified presentence reports, which are less comprehensive, represented 6 percent of total presentence investigative reports. Non-guideline reports, which involve offenses for which the Sentencing Commission has not promulgated guidelines and include reports addressing petty offenses, reports for treaty transfer cases, and supplemental reports to the Bureau of Prisons, constituted 1 percent of investigative reports and remained unchanged at 136.
Substance Abuse Treatment
Federal offenders receive substance abuse treatment from a variety of sources—state programs, local programs, the Department of Veterans’ Affairs, and judiciary-funded substance abuse treatment services. The data presented here reflect only judiciary-funded substance abuse treatment and exclude costs associated with substance abuse testing.
Of the 76,636 offenders under supervision with court-ordered substance abuse treatment conditions, 23,296 received judiciary-funded treatment (up 3,450 offenders from 2014). The Federal Judiciary spent an average of $1,494 per offender (up $519) for a total of $27.2 million (up $7.8 million). Nationwide, 30 percent of offenders with conditions requiring substance abuse treatment received judiciary-funded treatment, up from 26 percent in 2014.
For additional information on judiciary-funded substance abuse treatment services in the federal probation system, see Table S-13.
Judicial Business 2015
- Judicial Business 2015
- Judicial Caseload Indicators
- Judicial Business 2015 Tables
- U.S. Courts of Appeals
- U.S. District Courts
- U.S. Magistrate Judges
- Judicial Panel on Multidistrict Litigation
- U.S. Bankruptcy Courts
- Criminal Justice Act
- Post-Conviction Supervision
- Pretrial Services
- Complaints Against Judges
- Status of Article III Judgeships
- Status of Bankruptcy Judgeships
- Status of Magistrate Judge Positions and Appointments
- U.S. Court of International Trade
- U.S. Court of Federal Claims